Other Topics
Exporting Your Data
You can export the data collected by VisibleTesla to an Excel file for your own analysis. There are three sets of data you can export:
- Statistics: The data that was gathered for the Graphs Tab. You can export this data using File→Export Stats Data... menu item.
- Locations: The data that was gathered for the Location Tab. You can export this data using File→Export Location Data... menu item.
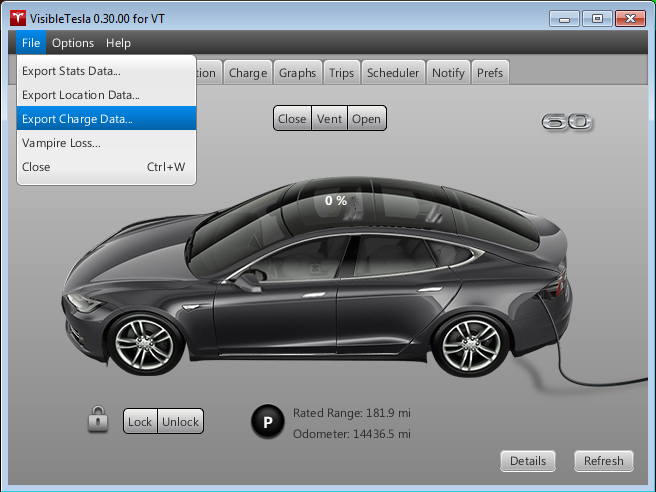
- Charge Information: The data that was gathered by the charge monitoring system. You can export this data using File→Export Charge Data... menu item.
In all cases you'll be prompted to choose a location and name for the exported file. Be sure to use the extension ".xls"; for example, MyStats.xls. The screen shot below shows the Export menu items.
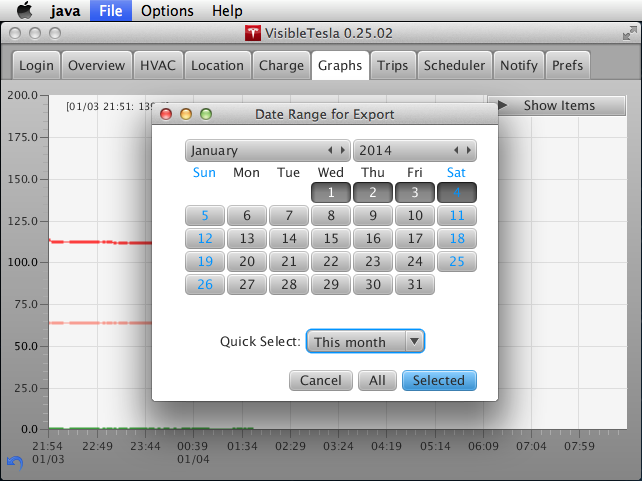
After you choose a file and location, you'll be asked how much of your data you want to export. You can select a range of days on the calendar by selecting the starting day then holding down the shift key and selecting the ending day. You can use the Quick Select dropdown list to easily select some common ranges. Once you've selected your range, press the Selected button. If you want to export all of your data, you don't need to bother with the calendar, just press the All button. To abort the export process, hit the Cancel button. This screen shot shows the dialog box that allows you to select a date range.
Statistics and Location Data
After exporting Statistics or Location, you can open the resulting file in Excel (or equivalent). You'll see a column corresponding to the time at which each reading was taken and a column for each type of data collected. The time column contains a long, unintelligible number which is an accurate, though obscure, way to keep track of time down to the millisecond. You'll notice that the last column has a version of the timestamp represented as a human-readable date. The table will look something like the one below (a sample of the stats data):
| TIMESTAMP | C_AMP | C_BAM | C_EST | C_ROC | C_SOC | C_VLT | S_PWR | S_SPD | |
|---|---|---|---|---|---|---|---|---|---|
| 1377743292 | 0 | 99.7 | -1 | 55 | 0 | 24 | 14 | 8/28/13 18:28:12 | |
| 1377746306 | 0 | 99.3 | -1 | 50 | 0 | 21 | 16 | 8/28/13 19:18:26 |
You may notice that some entries are blank. This is normal and can happen for a number of reasons. For example, the car may not have provided readings for that statistic at that time.
Charge Data
When you open the Excel file created by File→Export Charge Data..., you'll see that each row represents a separate charge cycle. The columns are:
| Columns | Description |
|---|---|
| Start Date/Time | The date and time at which this charge cycle began. |
| Ending Date/Time | The date and time at which this charge cycle ended. |
| Supercharger? | Did this charge cycle use a supercharger? |
| Phases | This column will contain a 3 if the charge cycle used a 3-phase charger. It will be 0 otherwise. |
| Start Range | The range remaining when the charge began. Note, this is always in miles regardless of the GUI setting. |
| End Range | The range remaining when the charge eneded. Note, this is always in miles regardless of the GUI setting. |
| Start SOC | The SOC when the charge began. This is a percentage. |
| End SOC | The SOC when the charge ended. This is a percentage. |
| Latitude, Longitude (2 columns) | The latitude and longitude during the charge. |
| Odometer | The odometer reading during the charge. Note, this is always in miles regardless of the GUI setting. |
| Peak Voltage | The highest voltage reached during the charging cycle. |
| Average Voltage | The average voltage over the duration of the charging cycle. Note that at the moment this is not a weighted average. |
| Peak Current |
The highest current reached during the charging cycle. If the car is being charged at a supercharger, then this represents the "battery current" (C_BAM). Otherwise it represents the AC current into the car (C_AMP).
|
| Average Current | The average current over the duration of the charging cycle. Note that at the moment this is not a weighted average. |
| Energy | The energy added by the charge. |
Tracking Vampire Loss
"Vampire Loss" is the name given to power that is drained from the battery while the car is stationary. This power goes into running the car's on-board systems and is minimized when the car is sleeping. VisibleTesla can help you track how much power you are losing while your car is sitting still. It will review your data and look for any period where your car is stationary (and not charging) for an hour or more. These are called "rest periods." For each rest period it keeps track of when the period started and ended, and the starting and ending range (in miles or km).
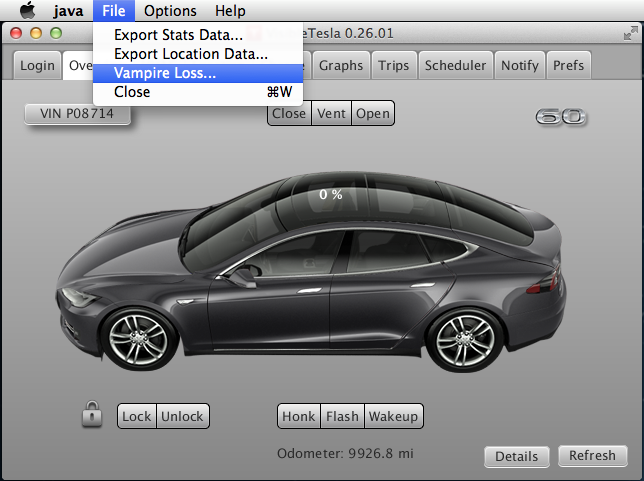
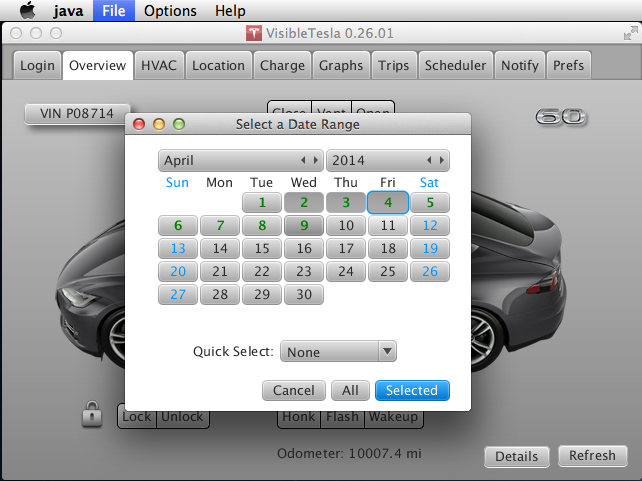
You can access this data in several forms using the File→Vampire Loss... menu item as shown below. Once you do that, a Date Range dialog will appear (see below). Choose a day or range of days that you want to review. You can use the Quick Select dropdown to easily choose common ranges. Days for which data is available are highlighted in green. If you want more days of historical data available, adjust the value of the Load data for preference in the General / Basic Preferences section of the Prefs Tab. If you choose days for which there is no data, no information will be shown.
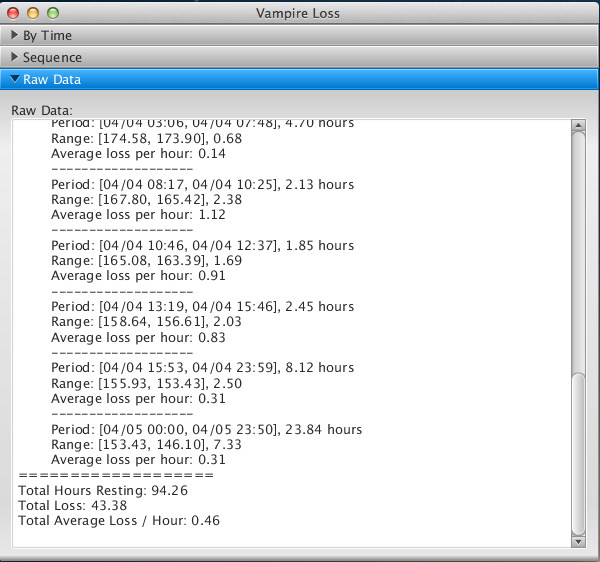
Once you've selected a date range, a new window will appear with three sections: Raw Data, Sequence, and By Time. As can be seen in the screen shot below, the Raw Data pane shows a dump of all of the rest periods and a summary of the overall Vampire Loss averaged across all of those periods.
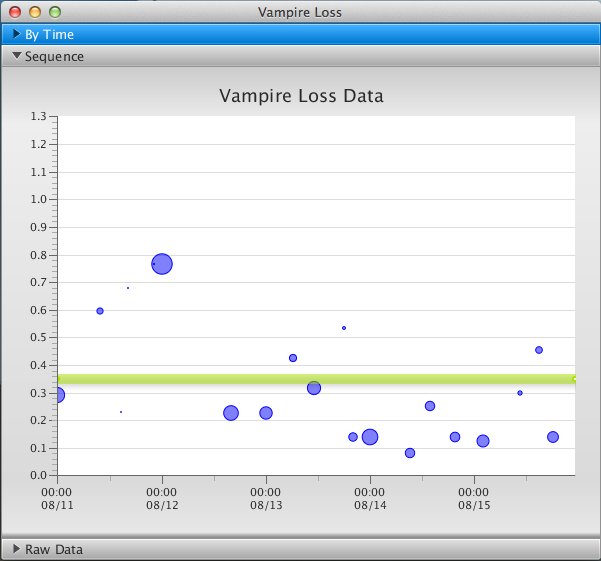
The Sequence chart simply displays a scatter plot of each of the rest periods in sequence. The y axis represents the amount of vampire loss (in miles lost per hour or km lost per hour), and the x axis is just a sequence number. If you hover your mouse over any data point a pop-up will be displayed that gives information about that rest period. You'll also notice a green line across the entire chart. It represents the average vampire loss across all rest periods (in miles lost per hour or km lost per hour). If you hover your mouse over any data point a pop-up will be displayed with additional information. In the screen shot below, the mouse is hovering over the end of the average line, so the pop-up displays the average.
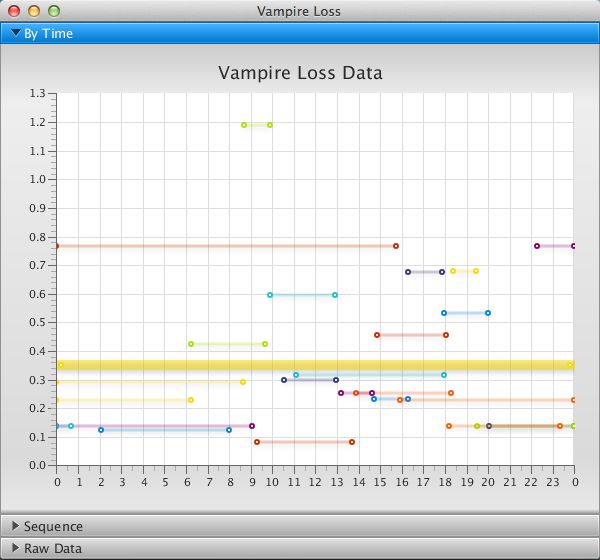
The final chart is called By Time. Like the previous chart, the y axis represents the amount of vampire loss. There is also a line across the entire chart which represents the overall average. That's where the similarities end. In this chart the x axis represents the hour of the day from 0-23. Each rest period is represented by a horizontal line segment which spans the starting time through the ending time of the period. The height of the line segment represents the degree of loss. Let's say your car is stationary every day from 10:00-14:00. You'll see a line segment for that period for each day in the range you selected.
This chart can be used to get a feel for when you car tends to be stationary and how much vampire loss there is during these periods. As with the Sequence chart, you can hover your mouse over any endpoint to see more detailed information about that rest period. If a period spans days (very common), it will be shown as two segments. In cases where your car sits idle for multiple days (what a shame!), the period will be broken up into multiple segments as needed.
Charge Monitoring
VisibleTesla monitors charge cycles and records information about them. This information can be exported as described above. You can use this information to keep track of your charging patterns and do other analysis. In the future, VisibleTesla may include graphs to visualize this information.
There is also an opt-in program to contribute anonymized information back to VisibleTesla.com so that it can be shared with the larger community. Note that this will never happen unless you explicitly turn on this feature in the Preferences Tab. The goal is to allow the community to collect a wide variety of charging information that may contribute to future battery and charging studies. Here is an example of the data submitted:
                    {"avgCurrent":17, "avgVoltage":238, "battery":"60kWh", "endRange":201, "endSOC":100,
                     "endTime":1414302158131, "energyAdded":5, "lat":37.470176, "lng":-122.154436, "odometer":14435.3,
                     "peakCurrent":17, "peakVoltage":238, "phases":0, "startRange":201, "startSOC":100,
                     "startTime":1414302108061, "superCharger":false,
                     "uuid":"38370aebc1c3e9c78164b38c3d3d8874fa5e7b01d7362db8e14ef18550da1d57"}
This information is submitted to VisibleTesla.com via anonymous email. An email is sent to VisibleTesla.com that does not include any identifying information from your computer or your car. For example, it does not include your VIN, your email address, or your IP address. The message body, in it's entirety, is stored in the log file on your computer so you can double check it's annonymity. Contact to request that submitted data be removed.
We would like to be able to correlate all of the entries from the same car without using the car's VIN or any other personally identifiable information. To do that, VisibleTesla assigns each car a long random sequence of numbers and letters. This sequence is known by the car's owner, but not by anyone else including VisibleTesla.com. This sequence is refered to as a UUID - Universally Unique IDentifer. You can view your UUID via the Details button in the Overview Tab or the Display UUID button in the Preferences Tab.
Data Collection
Many of the Tabs in VisibleTesla collect data of one type or another to do their job. The Location Tab collects location-related data, the Charge Tab collects charge-related data, and so on. They only collect this data when they are the selected tab. For example, while you are viewing the Charge Tab it is collecting charge data, but as soon as you switch to the Location Tab, the Charge Tab stops collecting data and the Location Tab starts. A number of tabs don't collect any data (e.g. Login, Prefs). Some tabs collect data only as needed (e.g. Scheduler).
The Graphs Tab is special - it collects data even when you aren't viewing it. It's also opportunistic. It watches the data being collected by other Tabs and looks for anything it can use. In normal circumstances the Graphs Tab collects data every two minutes. If it sees your car in motion, it starts collecting data every 30 seconds. If your car stops, it continues collecting data every 30 seconds for a couple of minutes in case you're at a stop light or something like that. Eventually it will revert to collecting data at 2 minute intervals.
When viewing any tab you may refresh the displayed data by pressing the Refresh button. If you don't hit refresh, the information displayed may become stale. Switching tabs automatically refreshes the newly selected tab. The screen shot below shows the "spinner" that is displayed when the app is communicating with your car.
The Location Tab is a little different from the others. It auto-refreshes like other tabs, but when the car is in motion it uses a special feature called "Streaming" that allows it to collect data at a higher rate without overloading Tesla's servers.

Speaking of overloading Tesla's servers, VisibleTesla automatically monitors the rate at which it makes requests. If you manually press refresh multiple times in rapid succession, you may find that the spinner rotates for a longer than usual. The app is automatically slowing down its requests to Tesla's servers in order to remain a good citizen. The app may also choose to refresh certain items less frequently than others.
Web Services
For advanced users only - EXPERIMENTAL. VisibleTesla includes the ability to accept a *very* limited set of commands via http. At the moment, the only functionality available is setting the app's inactivity mode. Support for web (REST) services is off by default and should only be used by people who are comfortable with direct access to these sorts of services. If you do enable the service, it is protected via HTTP Basic Authentication. To enable this feature, read more about the settings in the Prefs Tab.
Once the service is enabled, you have selected a port (or used the default), and have set an authorization code (password), you may access the functionality using a web browser or a command line utility such as curl. The username for all commands is "VT". The password is whatever you establish in the preferences. Note that by default, these services will be visible only on your local network. To access them remotely, you must manually set up port forwarding or use other methods. This is for experienced network users only.
The following table lists the available functions and how to access them. In these examples, the host name is always 127.0.0.1. This is a place holder and should be replaced by your actual hostname or IP address, OR it may be used to access this service from the local machine.
| Function | URL |
|---|---|
| Set Inactivity mode to Stay Awake |
http://127.0.0.1:9090/v1/action/activity/wakeup
|
| Set Inactivity mode to Allow Daydreaming |
http://127.0.0.1:9090/v1/action/activity/daydream
|
| Set Inactivity mode to Allow Sleeping |
http://127.0.0.1:9090/v1/action/activity/sleep
|
| Return web page with links to the URLs mentioned above |
http://127.0.0.1:9090/pages/InactivityOptions.html
|
Let's say you have established a password of "tesla" in the advanced preferences (please don't use that as your password), and that your IP address is 192.168.1.45. You could set the app to Stay Awake mode with the following curl command. Note that this command contains your password in clear text - don't share it with anyone else:
curl http://VT:tesla@192.168.1.45:9090/v1/action/activity/wakeup
You can also initiate this command via a web browser. Just type the address (without username and password) into your browser's address bar as shown in the screen shot below. Once you do, you will be prompted to enter a username and password. Use VT for the username and your authorization code as the password. In the example above, this was tesla.

You can bookmark these URLs for easy access in the future. Alternatively, you can enter the URL http://192.168.1.45:9090/pages/InactivityOptions.html into your browser and you will receive a simple web page with with links to the three inactivity modes.
Why is this useful?
Setting the inactivity mode remotely is useful if your app is asleep and you are about to drive somewhere. If you want to be sure the trip is recorded without large gaps, you can make sure the app is awake using this mechanism. If you are really comfortable with configuring your home network, and are comfortable with the security, you can use port forwarding on your router along with a service like dyndns to allow you to access this functionality from outside of your home network. Roughly speaking you need to:
- Establish an external IP address for your home network using a system like dyndns.org. At that point you'll have a publicly visible address like:
TheAndersons.dyndns.org - Use your router to set up port forwarding to the machine that is running VisibleTesla. Assuming you didn't change the port, you would set your router so that TCP traffic that is bound for port 9090 gets sent to port 9090 on the machine that's running VisibleTesla. This may involve giving that machine a static IP address.
- Try it out! From a web browser on a machine that is not on your home network, try accessing one of the commands. For example, you can enter the URL below. You will be prompted for your username and password (remember, the username is always "VT"), and once you enter them, you'll see a simple web page with the other options listed.
http://TheAndersons.dyndns.org:9090/pages/InactivityOptions.html
Getting Status
You can receive basic status about your car using the url:
http://192.168.1.45:9090/pages/VehicleStatus.html
Remember, you need to use your IP address or hostname. When you enter this URL, you'll get a page back with a table that looks similar to this:
Vehicle Status as of 2014-06-07 10:27:27
| Item | Value |
|---|---|
| SOC | 73% |
| Ideal | 168.6 mi |
| Rated | 148.2 mi |
| Estimated | 157.5 mi |
| Charge State | Disconnected |
| Speed | 27.3 mph |
| Location | 123 Main St., Menlo Park, CA 94025, USA |
| Inactivity Mode | Allow Sleeping, Current State: Awake |
Requesting status in this way will not wake up your car if it is sleeping. The data you receive will be the last known data. The car will not be asked for new information. The date and time shown at the top of the table correspond to when the table was prepared. the values in the table might be slightly older (or much older if your car is sleeping).
Custom Pages
VisibleTesla can serve up web pages that are designed by you and can include template variables. You need to store these pages in a folder where VisibleTesla can find them. That folder can be on the web or on your local machine. Either way, the location is specified by a URL in the Advanced Preferences. To access custom pages in this folder, use URLs of the form: http://localhost:9090/custom/MyCustomPage.html
In this example, you would have a file named MyCustomPage.html stored in the folder that you specified in the advanced preferences.